In this term, we have had a unique style of having classes—learning online, with the outbreak of COVID-19. We had to avoid the unnecessary trips to reduce the risk of being infected, so, social media have been accompanying us through the hard time. For this, as well as this course, I have deeply realized the indispensable place of social media.
The analysis of my blog
As my second and the third blog are based on Goal 10—inequalities, the topic is a little serious. So, my sentiment score of the comments is 0.0165, and the score shows the comments under my blog are neutral with a little positive in general.
Figure 1 The result capture of my project 1
As for the interaction of my blog, the in-degree of my received comments is 6, while the out-degree of my sent comments is 12. This could show that I was trying to interact with more people, but what I have received were not such ideal. The closeness centrality point of these comments is 0.38055, and this shows that my blog is not a center of the whole blog nets consisted of all classmates. The shortest-path betweenness point is 0.0165, which shows I am not likely to be a “transfer station” of other classmates.
Figure 2 The result capture of my project 2
Cooperation in presentation
One of the chances to communicate and cooperate with classmates is to prepare for the presentation. It is a relief to talk to someone, especially when we cannot talk as frequent as before.
After completing this presentation, I have had a new understanding on social media analytics. The social media under analysis can not only provide various of data to commercial companies, but also remind people in case of emergency. Our assumption could reach this goal—to build an fire alert system to remind people to evacuate as soon as possible.
Figure 3 & 4 Our assumption is to locate the fire spot by recognizing the photos related to fire on social media services, then we can calculate the precise fire spot with enough photos. After that, we can figure out the route of fire according to the wind speed and direction, and inform the influenced people to evacuate on social media services again.
Social Media & COVID-19
COVID-19 originated in Wuhan, China at the end of last year, and it is still spreading all over the world, and some of the information epidemic is spread on social media services. Social media plays a role in supervising the information disclosure of government and criticizing their misconduct.
Figure 5 There were still a lot of people commenting for Dr. Li Wenliang two months after his death, so as to express their disappointment and anger to the misconduct of government.
Actually, there is a new research on social media about COVID-19[1]. In this research, the researchers performed a comparative analysis on platform. They found that Gab is the most susceptible environment to misinformation diffusion, but information marked either as reliable or questionable do not present significant differences in their spreading patterns.
Figure 6 A part of the research outcomes
Conclusion
Social media defends our freedom of speech and broadens our source of information, and social media analytics can dig out the facts behind the data and contribute to our society.
This is the end of my blog. Thanks for your reading!
References
[1] Matteo Cinelli, etc. The COVID-19 Social Media Infodemic
Last time, we talked about reducing inequalities. How can we research this task with the help of social media analytics?
What can we do?
We may study income inequalities from individuals, and show this relationship by a tree. For example, if we learn from the social media that Bob is richer than Tom, and Tom is richer than Rachel, then we can draw a branch like Bob—Tom—Rachel. Then, we can put these branches into a tree. With the help of location sharing, we are able to speculate which regions are brownstone districts, and which are shantytowns.
Figure 1 The example of income-relationship tree
However, this would require disclosing the information behind a social media account, since the social networks such as Instagram, Facebook and WhatsApp do not share the information except what the users make visible on their pages [1].
Seems we have nothing to do research on income inequalities directly. Thanks for reading my blog!
So, do you think my blog is over? Actually not.
We cannot research on this topic directly, but we are able to study it indirectly. Here I will give two examples.
Using locations only
According to the research by Agustin Indaco and Lev Manovich, the inequality of Instagram images shared in Manhattan turns out to be bigger than inequalities in levels of income, and they have the same trend [2]. So, we may study income inequalities qualitatively with the help of social media inequalities.
Based on the geolocation and time of the photos uploaded onto the Instagram, the researchers have drawn out the density map of the usage of Instagram “Photos” and “Tags” by residents (defined as the users who shared a minimum of two photos within any interval larger than 12 days for each person) in each census in Manhattan, New York City, which can help us know the trend of income inequalities.
Figure 2 The density map of the usage of Instagram in Manhattan. As you can see, Central Park and Hudson Yards have the most usage, which also reveals they are the top brownstone districts in Manhattan.
Locations+ How users make sense of social media
Well, there is actually another research revealing how the teenagers from different levels make sense of social media. The result was interesting: The teenagers in the ‘elite’ group used Facebook in ways that were beneficial and constructive for themselves, such as increasing knowledges, sharing information and obtaining benefits across a variety of fields, while those from working class or petite bourgeoisie backgrounds prefer Facebook’s social features than its knowledge ones, as they believed that social media were especially helpful for making new friends and initiating or managing romantic relationships, so as to ‘hang out’ with friends and receive emotional support [3].
Combining with the locations as well as what sort of functions the users are likely to use, we can estimate the class of users, and mark them on the map. Then we can clearly see income inequalities from the map.
Conclusion
If we utilize social media analytics to reduce inequalities, we always need to use the positions shared on social media services, as well as the disclosing information on these services and theoretical support. However, we still expect the service providers could open the data to the specific research organizations, so that they can do their research through these data, not only to understand income inequalities better, but to benefit all human beings.
This is the end of my blog. Thanks for your reading!
[2] Agustin Indaco; Lev Manovich(2016). Social Media Inequality: Definition, Measurements, and Application. Forthcoming in Urban Studies and Practices journal.
[3] Marina Micheli (2016) Social networking sites and low-income teenagers: between opportunity and inequality, Information, Communication & Society, 19:5, 565-581, DOI: 10.1080/1369118X.2016.1139614
In 2015, the Sustainable Development Goals (SDGs) were set by the United Nations General Assembly, one of the six principal organs of the United Nations (UN) [1][2]. These 17 goals intended to be achieved by 2030.
Today, I’m going to talk a little about Goal 10—Reduced Inequalities.
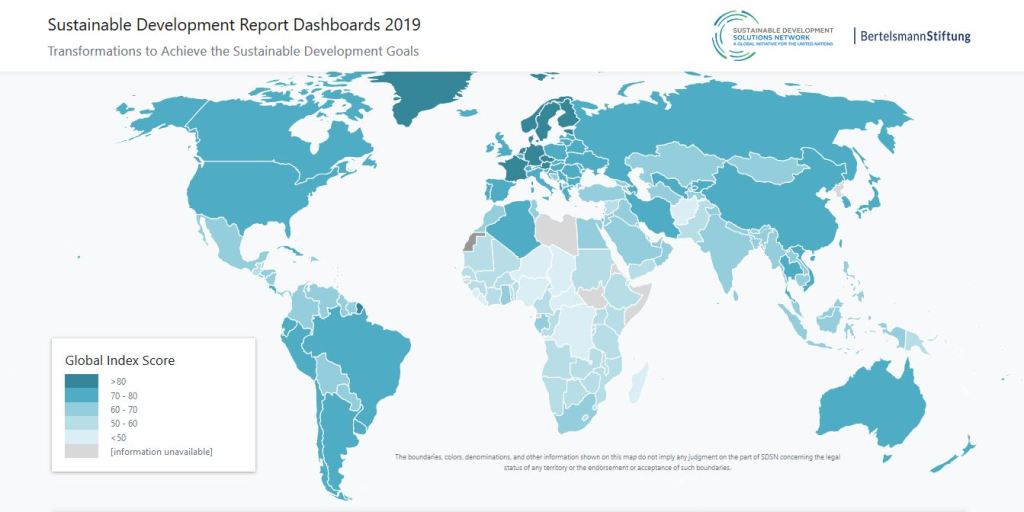
Figure 1 World map showing countries that are closest to meeting the SDGs (in dark blue) and those with the greatest remaining challenges (in the lightest shade of blue) in 2018. CC BY-SA 4.0
Backgrounds
The international community has made significant progress on lifting the poor out of poverty, especially those who live in the least developed countries. In 2016, over 64.4% of products exported from these countries faced zero tariffs, which improved their competitiveness in the world[3].
However, inequality persists and large disparities still remain. Evidence shows that children in the poorest 20 percent of the populations are still up to three times more likely to die before their fifth birthday than children in the richest regions. More seriously, with the protectionism prevailing, the products from these countries seem much harder to export[3].
I think most of us are rich, but we need to look back to those who need help, huh?
The poor in Hong Kong
Figure 2 MTR Sham Shui Po Station
When we talk about the poor in Hong Kong, a place often comes to our mind—Sham Shui Po, as well as another word—subdivided flat.
Because of the fire taken place in Shek Kip Mei in 1953, Hong Kong government began to build public rental housing for those who lost their home [4]. According to the housing figures published by transport and housing bureau in 2019, 29.1% of Hong Kong citizens live in public rental housing [5].
Unfortunately, there are still a lot of people waiting to live in public rental housing. It is reported that the average waiting time for moving into public rental house has increased to 5.5 years [6]. So, the families who cannot afford the private flat have to live in subdivided units, or even cage home.
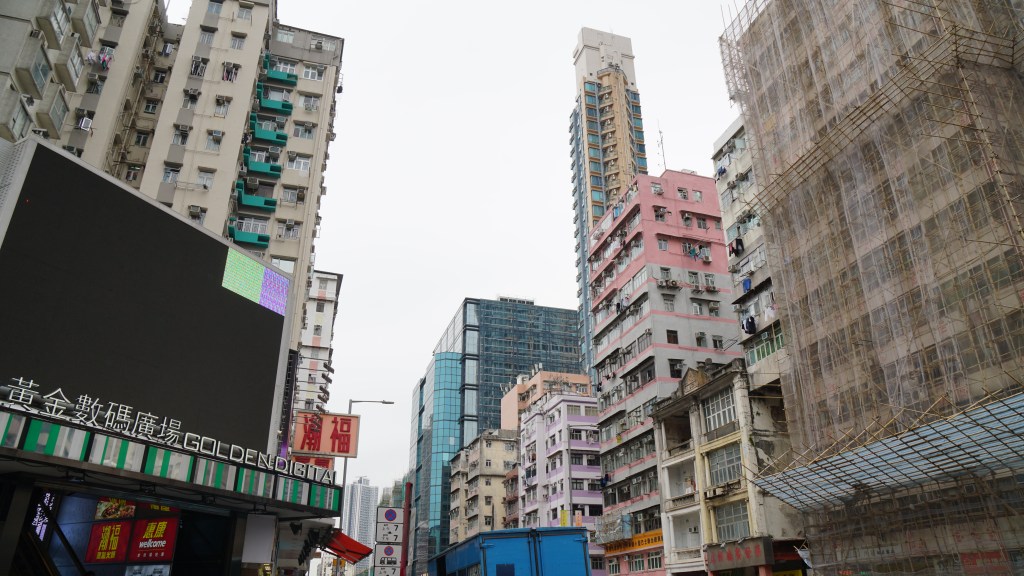
Figure 3 The tall buildings are built among the old ones in Sham Shui Po
On the other hand, new tall building is being built among the shabby ones, which seems ironic, and raise a question: Why is there such a big gap?
Actually, the wage distribution in Hong Kong is based on education level. A job which requires high education are often attached with high salary. Instead, the jobs that do not require high education, such as safe guard and waitress, will be paid much less. In order to survive, they have to work for more than 70 hours per week to earn extra benefits, or get two jobs at the same time.
I have asked the safe guard in my estate during the fiercest struggle last November. She said there were no bus services at that time, and she had to take MTR for more than an hour to go for work. That’s too hard for them!
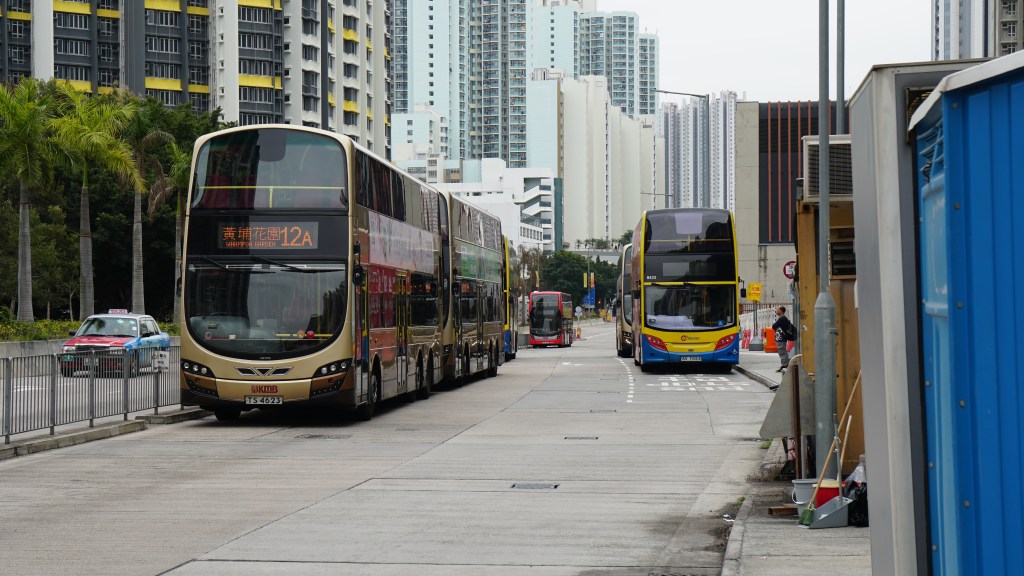
Figure 4 Cheung Sha Wan bus terminal. Most of the bus drivers in Hong Kong have to work for more than 10 hours per day for their families to survive. They have no choices but to rest in the shack shown in the right side of the photo.
The income gap in China
The salary is also proportional to education level that the job requires in mainland China. So, most of the senior students are likely to submit their resumes to finance companies, even if they do not major in the related majors.
Well, let’s change another perspective to see the inequality inside the country.
Here is an example. Just compare the salary of the same job—AI engineer, in different regions. In Hong Kong, you can earn 18,000 RMB on average per month, while in the big cities inland, such as Beijing and Shanghai, you are able to earn this amount, but you have to work more than 60 hours per week to achieve that. Things are even worse in smaller cities, where you will earn no more than 14000 RMB for salary, usually accompanied with no-paid overtime work.
As a result, an increasing number of people are likely to rush to big cities to hunt for a job, and even the vacancy of a deliveryman could be competitive.
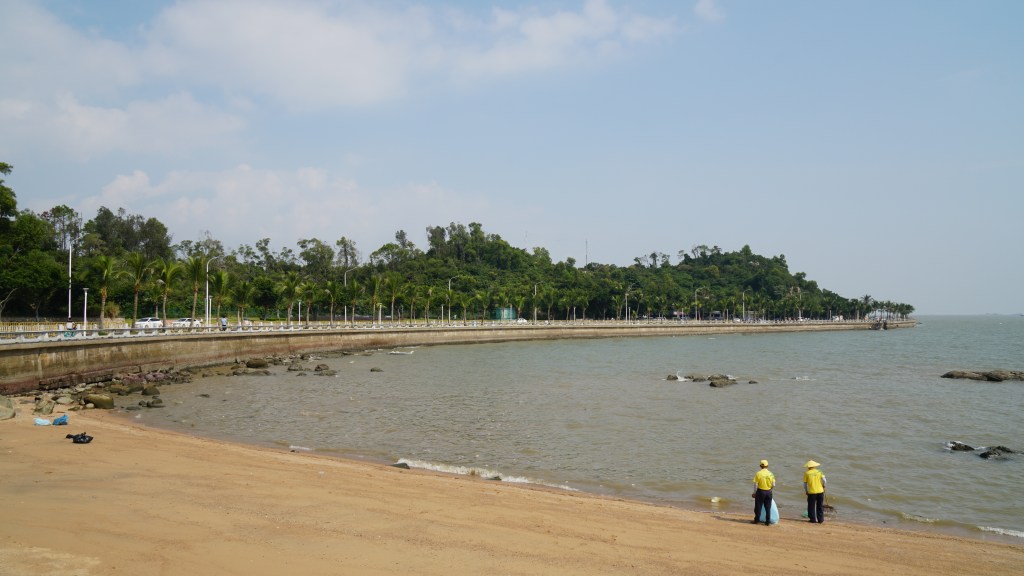
Figure 5 Sanitation workers cleaning up hard on the beach in Zhu Hai
What can we do?
Seems we can do something to alleviate these problems. We can comment the salary of our companies on a comment site, or write a blog to describe your salary situation
However, these cannot eradicate the problem. This issue needs to be addressed at the government level. Here I just give several suggestions.
Reduce the land price. As we all know, nothing can be done without land. These days, the bosses are not likely to rise salary for the employees for the rent pressure, especially for the small companies as well as self-employed business. Reducing the rent may help them reduce the pressure on operation and give more salaries to the employees.
Give more chances to the poor on better education. Nowadays, we are not able to get good grades in college entrance examination only relying on our school. We have to take after-school lessons or take tutoring classes to learn better. Unfortunately, the students in undeveloped regions do not have the chance and the money to enhance themselves. The education policies should lean towards the poor, or they will never have the chance to become rich.
Reduce tax rates for the poor. This can reduce their burden and increase their income. One of the effective ways is to implement progressive taxation to redistribute the wages of all members in society.
Figure 6 Glassdoor is one of the most popular job-related websites in the world, where you can check the reviews of a company.
Thanks for reading my blog! Please feel free to discuss these issues with me.
Imagine you are using app dianping.com at the end of the year, and here comes a summarize of your usage of this app in the whole year. You can check who ‘liked’ your evaluation to the restaurants most, and who commented your evaluation most. Well this is a siImagine you are using dianping.com at the end the year, and here comes a summarize of your usage in this website around the whole year. You can check who ‘liked’ your evaluation to the restaurants most, and who commented your evaluation most. Well, this is just a simple example about social media analytics.
Figure 1 The annual analysis of Luckin Coffee.
So what is social media analytics?
First, we need to know what the social media are.
Social Media
According to Wikipedia, social media are defined as “interactive computer-mediated technologies that facilitate the creation or sharing of information, ideas, career interests and other forms of expression via virtual communities and networks.”[1][2] Hmm, seems a little abstract.
Let’s put it in another way. Engaging with electronic services like laptops and smartphones, users create interactive platforms where other people can discuss, share, modify and co-create user-generated or self-generated content posted online. In other words, everyone can be the protagonist in the social media.
There are several social media services that have the number of users of over 100 million, such as Facebook, YouTube, WeChat, Instagram and Baidu Tieba, etc.
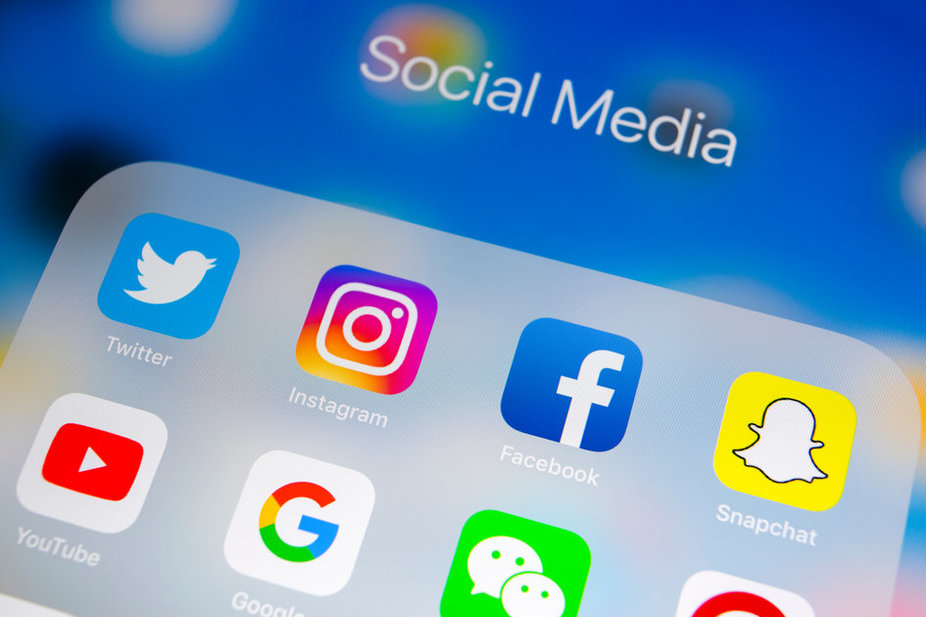
Figure 2 Some of the most popular social media services around the world.
Social Media Analytics
Social media analytics is defined as the process of acquiring and analyzing data from social network.[3] In other words, your information on social media services will be collected for analysis, and an incredible result may come out from these data.
For example, you subscribe some kinds of videos, and you may receive a summary that tells you what your character are.
Actually, there are some social media services that provides basic data analytics, such as Twitter Analytics, LinkedIn Analytics, Bilibili Analytics and Instagram Sights.[4]
Figure 3 The performance of my Bilibili Channel. For visiting my Bilibili channel, please chick here, and for my Youku channel, please click here. (Shh, you have found a channel with the playback of over 1,000,000)
Process for Social Media Analytics
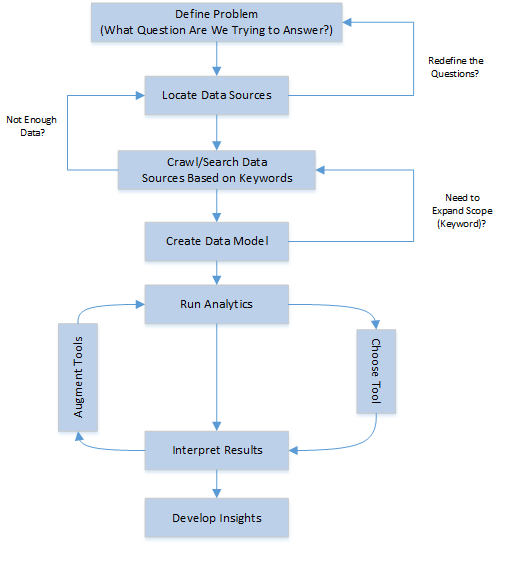
There are three steps for social media analytics:
Data identification: The process of identifying a subset of the available data for analysis. The features of data, such as structure, language, region, type of content, venue, time and ownership of data, need to be considered.[5]
Data analysis: The activities that assist in transforming the original data into insight. This step starts once we know what problem we are going to solve and we have prepared sufficient data for converting them into a meaningful result. Also, a model is needed for organizing data and standardizing how the individual data relate to each other. It is handy to have several tools available to gain a fresh perspective on discussions around the topic, which will be mentioned below.[5]
Information interpretation: The step to output the results. As the receivers are usually without technical knowledge, the way of showing the data becomes significant for them to realize the outcomes easily. The best answer of this question is always the visualization.[5]
Figure 4 The basic procedures of social media analytics. CC BY-SA 4.0
Social Media Analytics Tools
Well, it’s hard to recommend the tools for social media analytics, for I haven’t use them, and most of the recommendations on the Internet are for commercial purposes. So I just set several examples of good deeds for you to follow.
Google Analytics: The go-to analytics tool for the website. It provides a variety of valuable information about how your customers interact with your company online, which can be found in Social Pages report.
Audiense: The tool to help you understand your Twitter audience better, so that you can create more targeted campaigns and earn more money from advertisements. The characteristics, the interests and the location of audience can be clearly shown in this tool.
Thanks for reading my blog!
References
[1] Kietzmann, Jan H.; Kristopher Hermkens (2011). “Social media? Get serious! Understanding the functional building blocks of social media”. Business Horizons (Submitted manuscript). 54 (3): 241–251.
[2] Obar, Jonathan A.; Wildman, Steve (2015). “Social media definition and the governance challenge: An introduction to the special issue”. Telecommunications Policy. 39 (9): 745–750.
[5] Ganis, Matthew; Kohirkar, Avinash (2015). Social media Analytics: Techniques and insights for Extracting Business Value Out of Social Media. New York: IBM Press. pp. 40–137. ISBN 978-0-13-389256-7.